
Analyzing Token Holders and Distribution
Mind Gains provides detailed holder analysis for any Solana token. View holder trends, distribution, top wallets, and safety metrics to assess token risk and smart money positioning.
Accessing Holder Analysis
Paste any Solana token contract address in the "Paste CA" field at the top of the app. The token page displays four tabs: Holders, Top Wallets, Safety, and Buy.
Holders Tab
The Holders tab shows real-time holder statistics and trends alongside the token price chart:
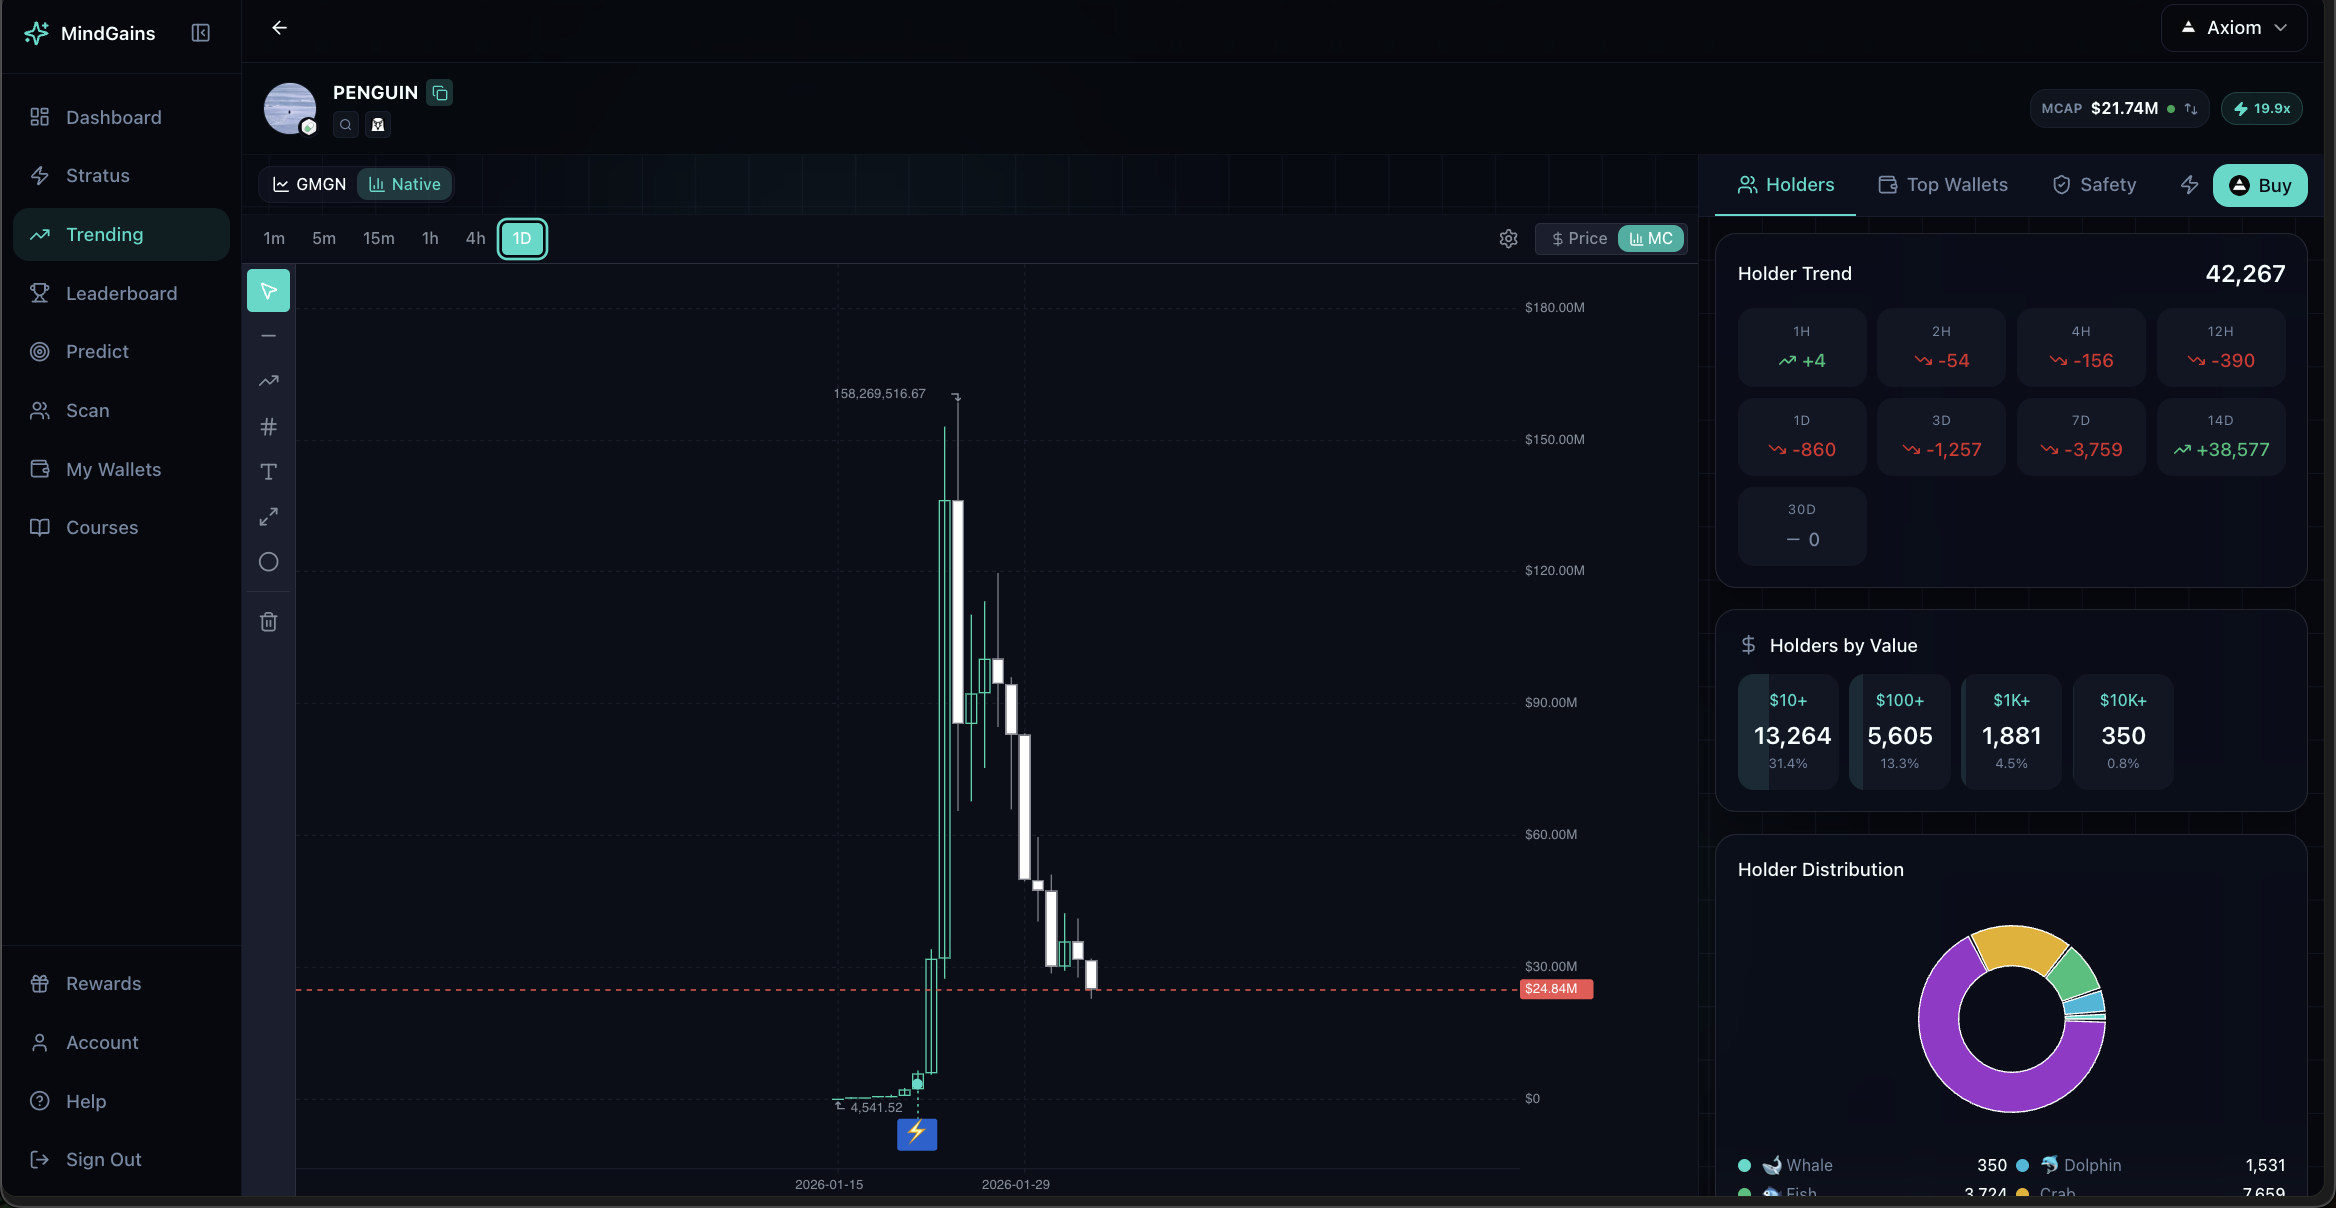
Holder Trend displays changes in holder count across multiple timeframes:
1H, 2H, 4H, 12H (hourly intervals)
1D, 3D, 7D, 14D, 30D (daily intervals)
Green (+) numbers indicate growing holder base; red (-) shows declining holders. Rapid holder growth often signals increasing interest.
Holders by Value breaks down holder counts by position size:
$10+, $100+, $1K+, $10K+, $100K+, $1M+
This shows concentration at different investment tiers. High counts in $10K+ categories suggest serious money is involved.
Holder Distribution visualizes the breakdown as a donut chart for quick assessment.
Watch for tokens with increasing holder counts and growing $10K+ positions—these often indicate smart money accumulation.
Top Wallets Tab
The Top Wallets tab ranks the largest holders and shows their other positions:
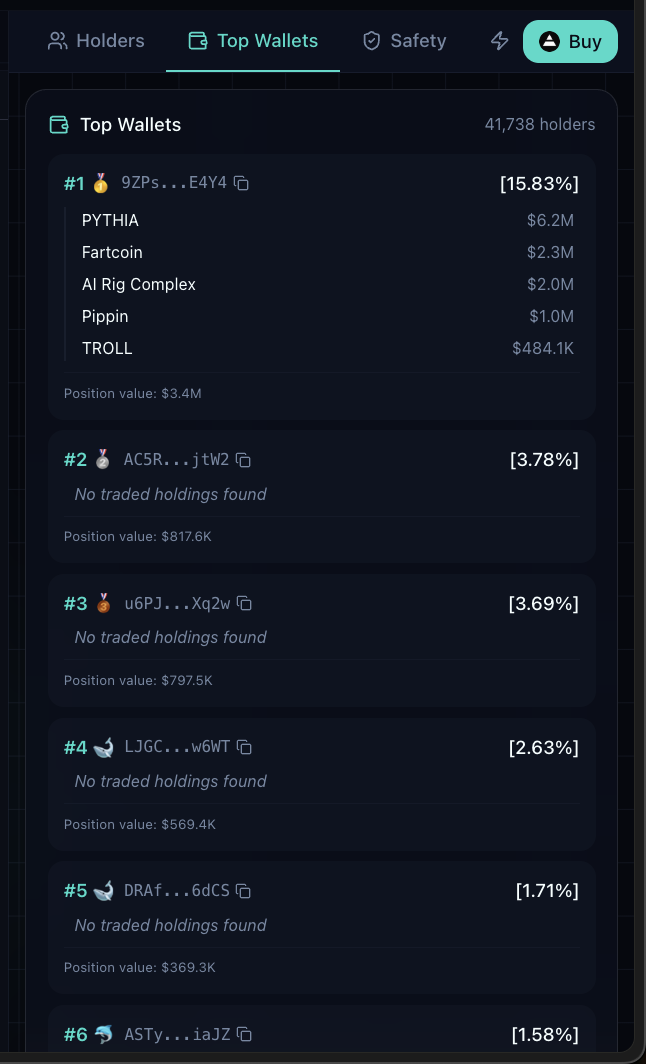
Each wallet entry displays:
Rank: Position in top holders list
Wallet address: Truncated address (click to copy)
% Held: Percentage of total token supply this wallet owns
Holdings: Other tokens this wallet holds (if traded)
Total Position: Dollar value of their position in this token
For top wallets with trading history, you'll see their other holdings listed with current market values. This reveals whether smart money is diversified across multiple plays or concentrated in single bets.
If top wallets show "No traded holdings found," they may be fresh wallets, dev wallets, or inactive holders. Cross-check with Safety metrics.
Safety Tab
The Safety tab categorizes risky holdings to help you spot red flags:
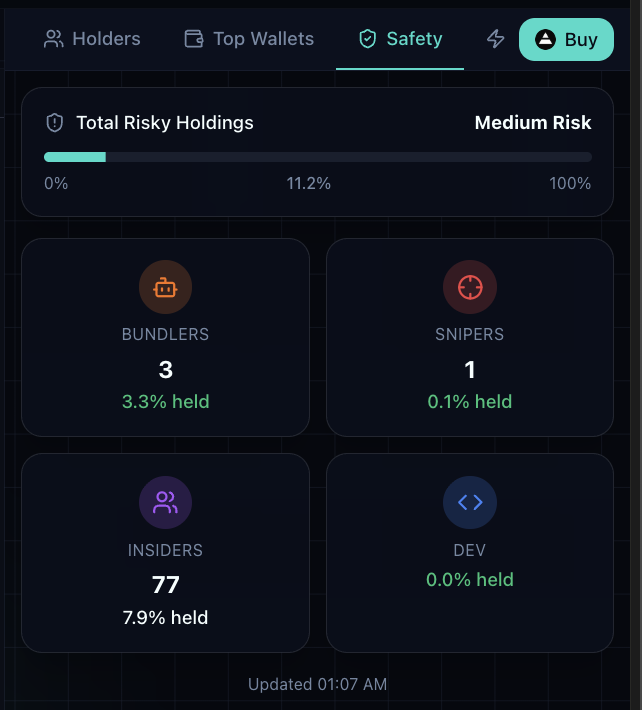
Safety metrics include:
Total Risky Holdings: Overall risk level (Low/Medium/High) with percentage of supply held by risky wallets
Bundlers: Wallets that bundle multiple transactions (often bots or coordinated buyers)
Snipers: Wallets that bought in the first seconds of launch
Insiders: Wallets with pre-launch or privileged access
Dev: Developer and team wallets
Each category shows the number of holdings and percentage of total supply held.
High insider or dev percentages (>10%) increase rug risk. High sniper counts may indicate botted launches. Use this tab to assess whether a token has clean distribution or potential red flags.
Safety metrics update in real time. Check the timestamp at the bottom to see when data was last refreshed.
Saving Wallets
Click the star icon next to any wallet address to save it to My Wallets for ongoing tracking (Pro feature). This works across Top Wallets, scan results, and signal feeds.
Free vs Pro
All users can view basic holder stats. Pro members get advanced filters, export capabilities, and the ability to save wallets for long-term tracking.